During these difficult times in America what have we learned from history?
The answer is NOTHING.
For me I have learned much & will defend it forever:
NEVER AGAIN!

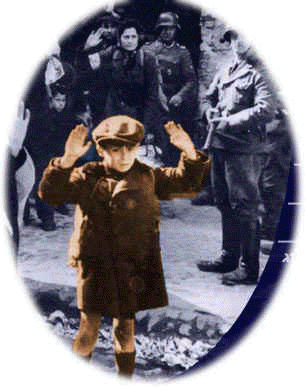
Picture (with Poem) of a Small Boy Captured
During the April-May 1943 Warsaw Revolt
. |
| |||||||||

JERRY WOLKOFF BLOG-IN LOVING MEMORY OF MY SON STEVEN NATHANIEL WOLKOFF, MY FATHER SAMUEL WOLKOFF, AND ALL THE OTHER VICTIMS OF INJUSTICE, EVIL IN THIS WORLD.THEY DIMINISH YOUR RIGHTS,THEN THEY DIMINISH YOUR EXISTENCE, THEN THEY LIE ABOUT IT, SAY YOU NEVER EXISTED, AND THE PROBLEM IS PEOPLE FORGET THE SUFFERING THAT LASTS FOREVER, NEVER KNOWING THE TRUTH BY WHOSE HANDS, OR HOW YOU WERE KILLED.
. |
| |||||||||


| Here's the still being tabulated National popular vote count, from the AP as of 10:30 PM, Nov.10, 2016:
| |||||||||||
| The number of eligible voters who turned out in 2016 was a slight increase in eligible voter turnout from 2012. FEC data from that election shows that 54.87 percent of the voting age population cast a vote for president, or 129,085,410 of the 235,248,000 eligible voters cast a vote. However, 2016 was still far from the high reached in 2008, when 58.23 percent of the voting-age population participated. In 2008, 131,313,820 total votes were cast.
In Minnesota, enough people cast ballots to put the state at the top of the pile, said Steve Simon, Minnesota's top election official.
With its higher-than-average education and incomes, Minnesota has traditionally led the country in voter turnout, although it did slip to sixth place nationally in the 2014 midterm election.
|
| STATE | Donald Trump | Hillary Clinton | Lead |
| Alabama | 1,303,576 (62.9%) | 717,138 (34.6%) | 586,438 |
| Alaska | 129,786 (53.0%) | 92,013 (37.6%) | 37,773 |
| Arizona | 947,175 (49.7%) | 864,053 (45.3%) | 83,122 |
| Arkansas | 677,904 (60.4%) | 378,729 (33.8%) | 299,175 |
| California | 2,965,704 (33.2%) | 5,481,885 (61.5%) | 2,516,181 |
| Colorado | 1,075,770 (44.8%) | 1,126,384 (46.9%) | 50,614 |
| Connecticut | 637,919 (41.7%) | 823,360 (53.9%) | 185,441 |
| Delaware | 185,103 (41.9%) | 235,581 (53.4%) | 50,478 |
| Florida | 4,605,515 (49.1%) | 4,485,745 (47.8%) | 119,770 |
| Georgia | 2,068,623 (51.3%) | 1,837,300 (45.8%) | 231,323 |
| Hawaii | 128,815 (30.0%) | 266,827 (62.2%) | 138,012 |
| Idaho | 407,199 (59.2%) | 189,677 (27.6) | 217,522 |
| Illinois | 2,117,479 (39.4%) | 2,976,534 (55.4%) | 859,055 |
| Indiana | 1,554,959 (57.2%) | 1,029,127 (37.9%) | 525,832 |
| Iowa | 798,923 (51.8%) | 650,790 (42.2%) | 148,133 |
| Kansas | 655,035 (57.2%) | 413,482 (36.2%) | 241,553 |
| Kentucky | 1,202,942 (62.5%) | 628,834 (32.7%) | 574,108 |
| Louisiana | 1,178,004 (58.1%) | 779,535 (38.4%) | 398,469 |
| Maine | 328,546 (45.1%) | 349,922 (47.9%) | 21,376 |
| Maryland | 873,646 (35.3%) | 1,497,951 (60.5%) | 624,305 |
| Massachusetts | 1,082,521 (33.5%) | 1,964,433 (60.8%) | 881,912 |
| Michigan | 2,278,630 (47.6%) | 2,265,938 (47.3%) | 12,692 |
| Minnesota | 1,321,003 (45.4%) | 1,363,742 (46.8%) | 42,739 |
| Mississippi | 675,842 (58.3%) | 461,105 (39.8%) | 214,737 |
| Missouri | 1,585,753 (57.1%) | 1,054,889 (38.0%) | 530,864 |
| Montana | 260,767 (56.9%) | 161,341 (35.7%) | 99,426 |
| Nebraska | 485,819 (60.3%) | 273,858 (34.0%) | 211,961 |
| Nevada | 511,319 (45.3%) | 537,753 (47.9%) | 26,434 |
| New Hampshire | 345,379 (47.3%) | 346,816 (47.5%) | 1,437 |
| New Jersey | 1,502,524 (42.0%) | 1,964,586 (54.8%) | 462,062 |
| New Mexico | 315,875 (40.0%) | 380,724 (48.3%) | 64,849 |
| New York | 2,635,300 (37.5%) | 4,142,719 (58.8%) | 1,507,419 |
| North Carolina | 2,162,074 (50.5%) | 2,339,603 (46.7%) | 177,529 |
| North Dakota | 216,133 (64.1%) | 93,526 (27.8%) | 122,607 |
| Ohio | 2,771,984 (52.1%) | 2,317,001 (43.5%) | 454,983 |
| Oklahoma | 947,934 (65.3%) | 419,788 (28.9%) | 528,146 |
| Oregon | 725,090 (40.9%) | 919,591 (51.9%) | 194,501 |
| Pennsylvania | 2,912,941 (48.8%) | 2,844,705 (47.6%) | 68,236 |
| Rhode Island | 165,810 (40.3%) | 225,445 (54.9%) | 59,635 |
| South Carolina | 1,143,611 (54.9%) | 849,469 (40.8%) | 294,142 |
| South Dakota | 227,701 (61.5%) | 117,442 (31.7%) | 110,259 |
| Tennessee | 1,515,242 (61.1%) | 865,693 (34.9%) | 649,549 |
| Texas | 4,677,115 (52.7%) | 3,852,923 (43.4%) | 824,192 |
| Utah | 360,634 (46.8%) | 217,820 (27.8%) | 142,814 |
| Vermont | 95,025 (32.6%) | 178,072 (61.1%) | 83,047 |
| Virginia | 1,731,155 (45.0%) | 1,916,845 (49.9%) | 185,690 |
| Washington | 750,719 (37.8%) | 1,118,772 (56.3%) | 368,053 |
| West Virginia | 486,198 (26.5%) | 187,457 (68.7%) | 298,741 |
| Wisconsin | 1,409,467 (47.9%) | 1,382,210 (46.9%) | 27,257 |
| Wyoming | 174,248 (70.1%) | 55,949 (22.5%) | 118,299 |